In this study, I utilized Python, DIVA, Flux, and Genetic Algorithm(GA) to develop shading device and optimize the panels for the shading device. The following figure shows the rendered shading device.
Rendered shading device
This project consists of four parts, which are Cosine wave surface, the skin of the shading device, using excel to real time modify the panel of the shading device, and daylighting analysis and optimization.
The structure of the shading device
1. Cosine wave surface
In this study, I used the grid of points and individual anchor point to create the cosine wave surface. The number of the points can be modified in order to change the surface. The amplitude and period could also be changed to modify the height and period of the cosine wave surface. The simple python script only controls the Z value of the points for the grid.
The grasshopper nodes for the cosine wave surface
The simple Python script
2. The skin of the surface
The skin of the surface consists of two parts, which are the developed surface and the rectangle structure. For the developed surface, the original cosine wave surface is divided into multiple sub-surface by different U and V count and deconstruct each of the Brep into four points. Three of the four points are treated as the anchor points and find the closest points on the surface. The other point is treated as the modify point. The offset of the modified point can be changed to control the opening for the panels on the surface.
The grasshopper nodes for the skin of the surface
3. Using excel to real-time modify the surface
In this study, Flux is used to real-time modify the surface by using Excel. Flux is a plug-in for grasshopper, Revit, Dynamo, and Excel. The following figure illustrates the workflow of Flux.
The workflow of Flux
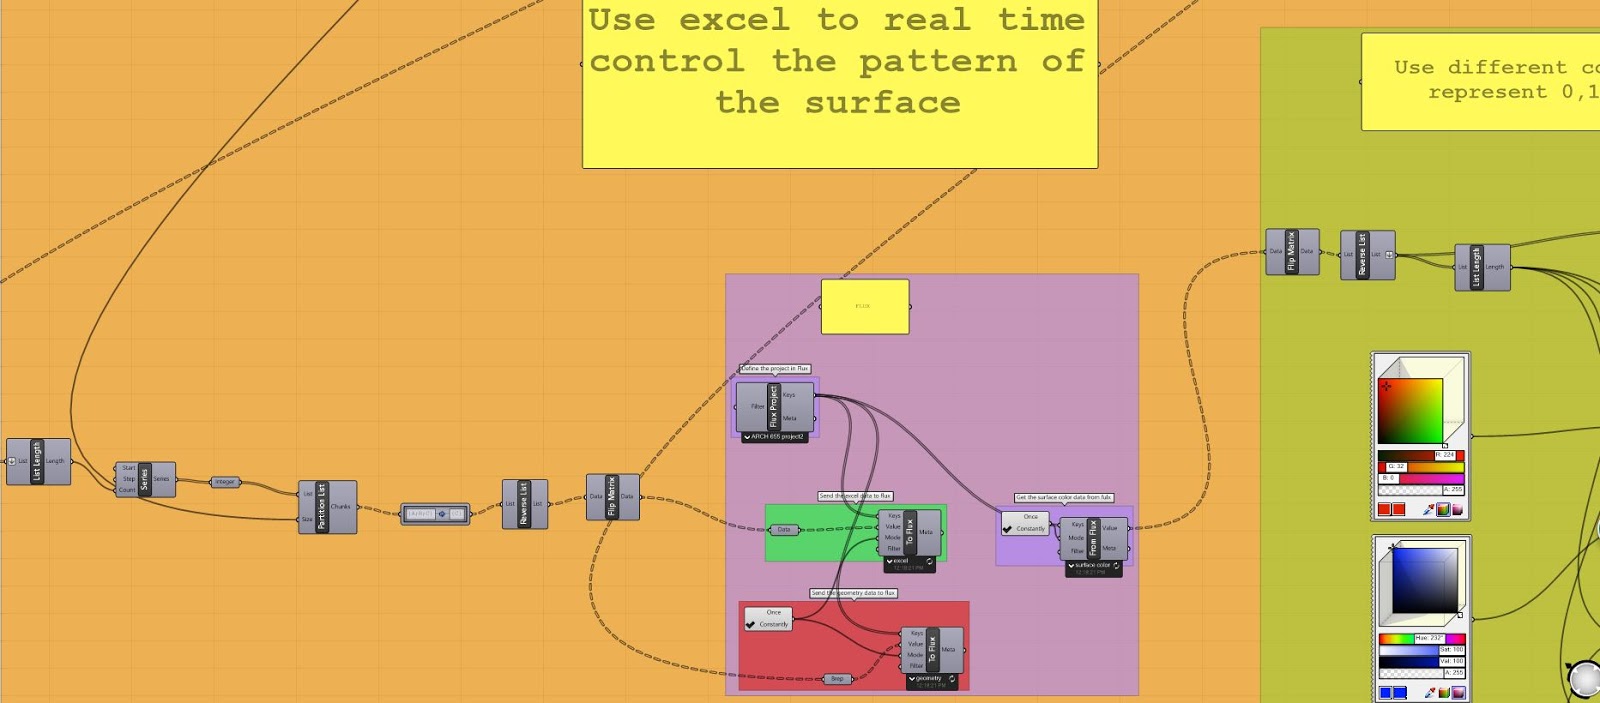
In the grasshopper, I send the flattened list panel data and geometry data to the Flux server using Flux node. In the Excel worksheet, I download the flattend list panel data from Flux server and update the panel data with 0,1,2,3 number pattern. I sent the updated number pattern back to Flux server. In the grasshopper, I set up a recive node to recive the updated data. Thus, the excel can real-time control the panel. In this study, I used different color to reprsent 0,1,2,3. You also can use different material or different layer to real time change the panel.
The grasshopper nodes for the Flux
4. Daylighting analysis and optimization
In this study, DIVA is utilized to analyis the daylight factor in grasshopper. The daylight factor is the ratio of the light level inside to the light level outside:
DF=(EI/EO) x 100%
The daylight factor will be projected to the surface under the shading device. The flowing figure shows the structure of the the daylighting analysis by using DIVA
For the daylighting optimization part, Galapagos is used to optimize the daylight factor for the shading device. The fitness of the Galapagos is the minimized diference between target daylight factor and the averge number of the daylight factor from DIVA. In study, daylight factor 5 is defined as the target daylight factor. In order to reduce the calculation load for optimization in this study, two surfaces with different UV count(5x5, 8x8) are tested. Both of the test have the result with flat surface and the result show restrain tendency.
The genome for the optimization
The fitness of the optimization
The result of 8x8 UV count panel
The result of 5x5 UV count panel
The optimized offset number and amplitude for 8x8 surface
The optimized average daylight factor for 8x8 surface
Picture credit from http://www.thousandwonders.net/Phoenix+International+Media+Center
1. Project description
Project Name: Phoenix International Media Center Location:Beijing, China Owner: Phoenix satellite television (east) Beijing Architectural firm (studio): BIAD UFo Design period:2007-2009 Construction period:2009-2012 Site area:18821.83 m2 Floor area:64973 m2 Above ground:35000 m2 Underground:29973 m2 Usage:media office, broadcasting studio, restaurants, parking garage, utilities and supporting facilities
Phoenix Television, one of the biggest media in China, is about the set itself apart from the competition with an incredible new building that defies the eye and pushes the boundaries of architecture design. The design intent comes from the "Mobius Strip" and the logo of the Phoenix Television.
Section:
Floor plan-Level 0:
Floor Plan-leve1:
Interior render:
Exterior render:
2. Parametric form (Mass and Skin) for the model
Parametric Mass:
1. Create a circle as a baseline for the model. The radius of the circle (the size of the model) can be parametrically modified. 2. Use Perp Frames node to create planes that are perpendicular to the plane of the circle. The number of the planes can also be parametrically modified. 3. Creat ellipses for each of the planes and rotates the ellipses though the baseline circle. The radius of the ellipse can be parametrically modified. 4. Loft the rotated ellipses though the baseline circle. 5. A series of nodes are added to make the bottom of the model is flattened.
The mass model
Baked mass model
The grasshopper nodes for the mass model
Parametric Skin: 1. Divide each of the ellipses. Make sure the number of the ellipes= the points on the ellipse. 2. Utilize the data structure(shift and flip nodes) to manage the points on the ellipse. Make sure the data is Graft before editing to the shift node. Use -X to create opposite curve 3. Use interpolate to create curves that connect these points 4. Use Perp frames to create planes that are perpendicular to the curves 5. Create rectangles on each of the planes and loft the rectangles
The surface of the model
Baked surface model
The grasshopper nodes for the surface
3. Parametric, physically-based for the model
Weaverbird and Kangaroo are used to create the parametric, physically-based model.
Physical model
Baked physical model
The grasshopper map for the physical model
4. Model analysis
A series of nodes are created to analyze the curvature of the mode.
The purpose of this final project is to using dynamo to control the material of the interior curtain panel. At the same time, the pattern of the colorful curtain panel will be controlled by the pattern in Excel. The building mass used in this final project is the same building mass in the project 1.
In this following picture, the pattern of the colorful curtain panel could be clear seen.
Use Dynamo in Revit
This image shows the whole Dynamo program.
This part of the Dynamo program shows the input process of divided surface in Reviit. By using the node of Select Divided surface families, the elements in Revit will be listed in Dynamo. By using the nodes of List Reverse and Flatten, the list of the elements will be fitted for the Excel.
This part of the Dynamo program shows the input process of the material. In this project, four different material will be implemented which are Glass, Glass 1, Glass 2 and Glass 3. The material in Revit will be transferred into the list of material in Dynamo.
The material of the curtain panel will be set up in the Materials in Management Tab.
This part of the dynamo program shows the input of the Excel pattern. The format of the Excel is .CSV.
This following picture shows the pattern in Excel. The size of the number pattern in Excel is 10 X 10 which is same to the surface U and V which is 10 X 10. In this image, 0 represent Glass, 1 represent Glass 1, 2 represents Glass 2 and 3 represents Glass 3.
This image shows the Python Script in Dynamo
The material of the curtain panel will be control by this node which is Element_set-parameter byName.
By using the process above, the material and the pattern of the curtain panel could be controlled by Dynamo.
Canton
Tower, also known as the Guangzhou TV Tower, is 600 meters tall, twisting over
the Haizhu District of Guangzhou capital of
Guangdong Province in China. Canton Tower is designed
by Information Based Architecture, a firm based in Amsterdam, The
Netherlands.
2. Modeling Process
1. Build Massing Model
I built the massing model in the Conceptual Mass by using reference lines and circles. Additionally, I set up the parameters for the height of the tower, the height of the antenna and the radius of the circle. The following figure shows the mass model I built and the parameters in the mass model.
By changing the parameters, the form of the building could be changed.
2. Parametric Curtain Panel for the Mass Model
By using the template of Curtain Panel Pattern Based, two parametric curtain panel are created. In these two families, the material and size are changed by the parameter,